fio测试磁盘rbd块存储等性能

前言:

测试硬盘iops时,-bs 可以指定小点,如4K;测试硬盘吞吐量时,-bs可以指定大点,例如4M

一. fio安装

1
2
3
4
# centos安装fio
yum install -y fio
# ubuntu安装fio
apt install -y fio

二. fio测试类型

1
2
3
4
5
6
7
8
9
10
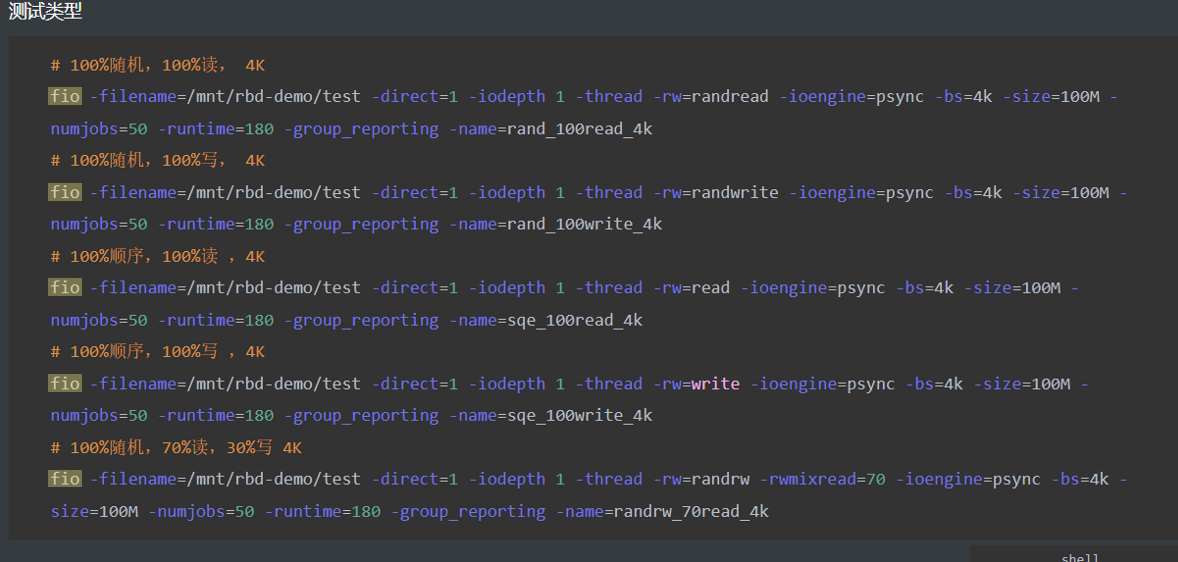
# 100%随机,100%读, 4K
fio -filename=/mnt/rbd-demo/test -direct=1 -iodepth 1 -thread -rw=randread -ioengine=psync -bs=4k -size=100M -numjobs=50 -runtime=180 -group_reporting -name=rand_100read_4k
# 100%随机,100%写, 4K
fio -filename=/mnt/rbd-demo/test -direct=1 -iodepth 1 -thread -rw=randwrite -ioengine=psync -bs=4k -size=100M -numjobs=50 -runtime=180 -group_reporting -name=rand_100write_4k
# 100%顺序,100%读 ,4K
fio -filename=/mnt/rbd-demo/test -direct=1 -iodepth 1 -thread -rw=read -ioengine=psync -bs=4k -size=100M -numjobs=50 -runtime=180 -group_reporting -name=sqe_100read_4k
# 100%顺序,100%写 ,4K
fio -filename=/mnt/rbd-demo/test -direct=1 -iodepth 1 -thread -rw=write -ioengine=psync -bs=4k -size=100M -numjobs=50 -runtime=180 -group_reporting -name=sqe_100write_4k
# 100%随机,70%读,30%写 4K
fio -filename=/mnt/rbd-demo/test -direct=1 -iodepth 1 -thread -rw=randrw -rwmixread=70 -ioengine=psync -bs=4k -size=100M -numjobs=50 -runtime=180 -group_reporting -name=randrw_70read_4k

image-20230613200220547

三. 测试效果 (主要看 bw io iops )

1
2
3
4
5
6
7
8
9
10
11
12
13
14
15
16
17
18
19
20
21
22
23
24
25
26
27
28
29
30
31
32
33
34
35
36
37
38
39
40
41
# 100%随机,100%读, 4K
root@ceph-1:/mnt/rbd-demo# fio -filename=/mnt/rbd-demo/test -direct=1 -iodepth 1 -thread -rw=randread -ioengine=psync -bs=4k -size=100M -numjobs=50 -runtime=180 -group_reporting -name=rand_100read_4k
rand_100read_4k: (g=0): rw=randread, bs=(R) 4096B-4096B, (W) 4096B-4096B, (T) 4096B-4096B, ioengine=psync, iodepth=1
...
fio-3.16
Starting 50 threads
rand_100read_4k: Laying out IO file (1 file / 100MiB)
Jobs: 50 (f=50): [r(50)][25.5%][eta 08m:55s]
rand_100read_4k: (groupid=0, jobs=50): err= 0: pid=19546: Wed Mar 1 17:46:39 2023
read: IOPS=1837, BW=7350KiB/s (7526kB/s)(1310MiB/182536msec)
clat (usec): min=314, max=3642.9k, avg=27202.59, stdev=217705.72
lat (usec): min=314, max=3642.9k, avg=27203.14, stdev=217705.73
clat percentiles (usec):
| 1.00th=[ 758], 5.00th=[ 963], 10.00th=[ 1106],
| 20.00th=[ 1369], 30.00th=[ 1663], 40.00th=[ 2147],
| 50.00th=[ 3097], 60.00th=[ 5342], 70.00th=[ 8160],
| 80.00th=[ 11600], 90.00th=[ 17695], 95.00th=[ 24773],
| 99.00th=[ 95945], 99.50th=[1635779], 99.90th=[3338666],
| 99.95th=[3472884], 99.99th=[3640656]
bw ( KiB/s): min= 350, max=42945, per=100.00%, avg=17074.17, stdev=301.72, samples=7850
iops : min= 50, max=10735, avg=4264.67, stdev=75.43, samples=7850
lat (usec) : 500=0.11%, 750=0.79%, 1000=5.25%
lat (msec) : 2=31.39%, 4=17.24%, 10=21.04%, 20=16.33%, 50=6.47%
lat (msec) : 100=0.38%, 2000=0.67%, >=2000=0.33%
cpu : usr=0.05%, sys=0.16%, ctx=342161, majf=0, minf=49
IO depths : 1=100.0%, 2=0.0%, 4=0.0%, 8=0.0%, 16=0.0%, 32=0.0%, >=64=0.0%
submit : 0=0.0%, 4=100.0%, 8=0.0%, 16=0.0%, 32=0.0%, 64=0.0%, >=64=0.0%
complete : 0=0.0%, 4=100.0%, 8=0.0%, 16=0.0%, 32=0.0%, 64=0.0%, >=64=0.0%
issued rwts: total=335394,0,0,0 short=0,0,0,0 dropped=0,0,0,0
latency : target=0, window=0, percentile=100.00%, depth=1

Run status group 0 (all jobs):
READ: bw=7350KiB/s (7526kB/s), 7350KiB/s-7350KiB/s (7526kB/s-7526kB/s), io=1310MiB (1374MB), run=182536-182536msec

Disk stats (read/write):
rbd0: ios=337590/6757, merge=1/29, ticks=2274317/134222, in_queue=1793584, util=99.62%

io=1310MiB # 执行了多少M的IO
bw=7350KIB/s # 平均IO带宽
iops=1837 # 磁盘读写单位'秒'
runt=60001-60001msec # 测试时间

iops w=2204:

image-20230613201102111

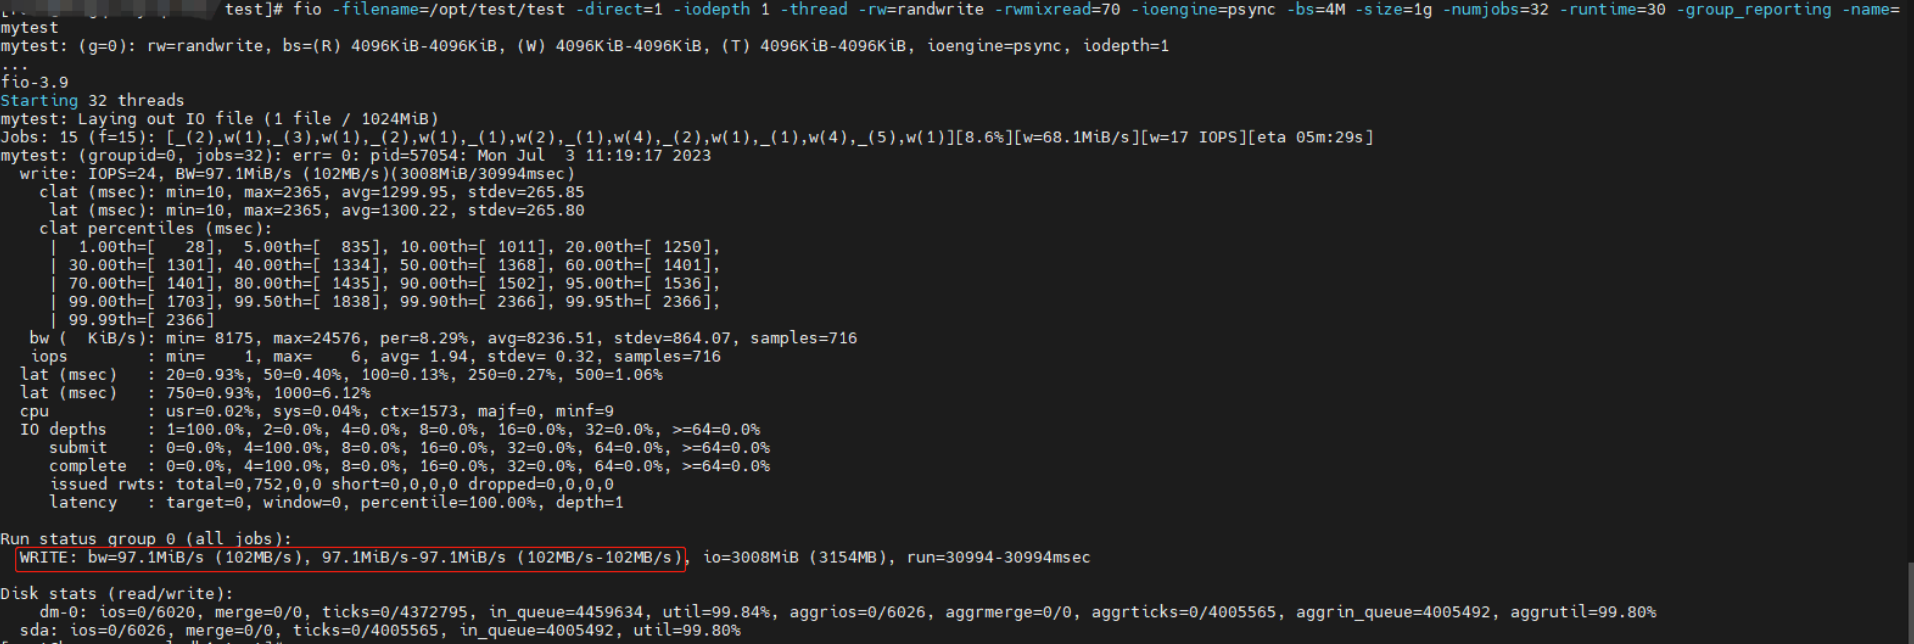
线程30 bw吞吐量102M/s:

image-20230703184254018

四. fio参数解释

fio参数解释 可以使用fio -help查看每个参数,具体的参数左右可以在官网查看how to文档,如下为几个常见的参数描述

1
2
3
4
5
6
7
8
9
10
11
12
13
14
15
16
17
18
19
20
21
22
# ---------------------------------分割线-----------------------------------------
filename=/dev/emcpowerb # 支持文件系统或者裸设备,-filename=/dev/sda2或-filename=/dev/sdb
direct=1 # 测试过程绕过机器自带的buffer,使测试结果更真实
rw=randwread # 测试随机读的I/O
rw=randwrite # 测试随机写的I/O
rw=randrw # 测试随机混合写和读的I/O
rw=read # 测试顺序读的I/O
rw=write # 测试顺序写的I/O
rw=rw # 测试顺序混合写和读的I/O
bs=4k # 单次io的块文件大小为4k
bsrange=512-2048 # 同上,提定数据块的大小范围
size=5g # 本次的测试文件大小为5g,以每次4k的io进行测试
numjobs=30 # 本次的测试线程为30
runtime=1000 # 测试时间为1000秒,如果不写则一直将5g文件分4k每次写完为止
ioengine=psync # io引擎使用pync方式,如果要使用libaio引擎,需要yum install libaio-devel包
rwmixwrite=30 # 在混合读写的模式下,写占30%
group_reporting # 关于显示结果的,汇总每个进程的信息
# 此外
lockmem=1g # 只使用1g内存进行测试
zero_buffers # 用0初始化系统buffer
nrfiles=8 # 每个进程生成文件的数量
# ---------------------------------分割线-----------------------------------------

测试报告参数解释

1
2
3
4
5
6
7
8
9
10
11
12
13
14
15
16
17
18
19
20
21
22
23
24
25
io=执行了多少M的IO
bw=平均IO带宽
iops=IOPS
runt=线程运行时间
slat=提交延迟
clat=完成延迟
lat=响应时间
bw=带宽
cpu=利用率
IO depths=io队列
IO submit=单个IO提交要提交的IO数
IO complete=Like the above submit number, but for completions instead.
IO issued=The number of read/write requests issued, and how many of them were short.
IO latencies=IO完延迟的分布
io=总共执行了多少size的IO
aggrb=group总带宽
minb=最小.平均带宽.
maxb=最大平均带宽.
mint=group中线程的最短运行时间.
maxt=group中线程的最长运行时间.
ios=所有group总共执行的IO数.
merge=总共发生的IO合并数.
ticks=Number of ticks we kept the disk busy.
io_queue=花费在队列上的总共时间.
util=磁盘利用率

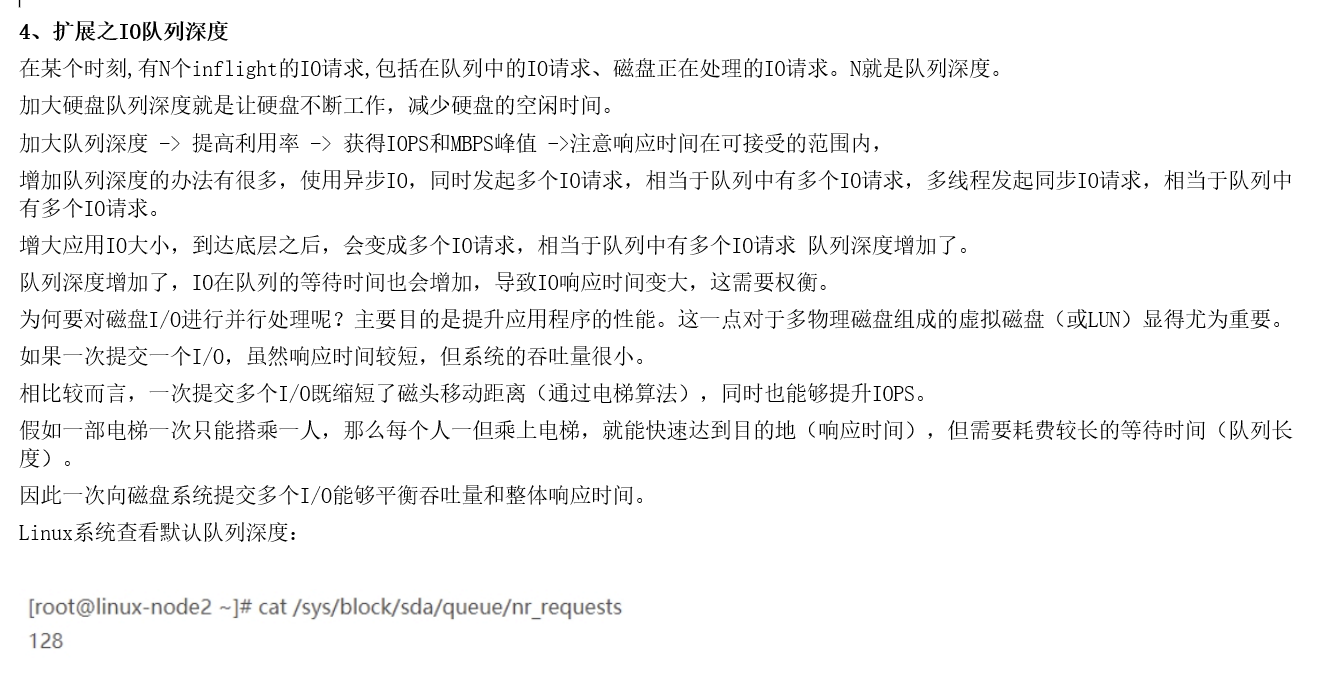
五. 扩展之io队列深度

image-20230613200438062

使用dd命令设置bs=2M进行测试:
dd if=/dev/zero of=/dev/sdd bs=2M count=1000 oflag=direct
记录了1000+0 的读入 记录了1000+0 的写出 2097152000字节(2.1 GB)已复制,10.6663 秒,197 MB/秒

可以看到2MB的IO到达底层之后,会变成多个512KB的IO,平均队列长度为2.39,这个硬盘的利用率是97%,MBPS达到了197MB/s。
(为什么会变成512KB的IO,你可以去使用Google去查一下内核参数 max_sectors_kb的意义和使用方法 )也就是说增加队列深度,是可以测试出硬盘的峰值的。